Understanding LCOS: A Deep Dive into Battery Lifecycle Costs

Energy storage procurement is shifting away from simple upfront price comparisons toward total cost per cycle. The true metric for grid-scale systems is battery lifecycle cost, most often expressed as the Levelized Cost of Storage (LCOS) in $/MWh. When evaluating bids, ignoring degradation patterns, round‑trip efficiency losses, and end‑of‑life management can slash projected returns. Project developers and procurement teams need a technical framework that isolates the real cost of delivered energy over the system’s rated life.
This article presents the key economic tools and engineering variables that determine lifecycle cost for BESS. We walk through the LCOS methodology, compare the long‑term performance of LFP, NMC, and Vanadium Redox Flow chemistries, and break down the cost components that often stay hidden in capex‑only analysis. Our aim is to equip technical buyers with the data and decision rules they need to move from $/kWh bids to an $/MWh‑per‑cycle procurement mindset.
Beyond CAPEX: The Importance of Lifecycle Cost in Energy Storage
Battery lifecycle cost is the total cost of owning and operating a storage system over its useful life, usually expressed as a Levelized Cost of Storage (LCOS) in dollars per megawatt‑hour throughput. It accounts for initial capital, ongoing operations and maintenance, charging electricity, degradation, and end‑of‑life disposal or recycling. Relying on capital expenditure per kilowatt‑hour alone can mislead buyers: a lower $/kWh upfront may hide higher replacement rates, poorer efficiency, or faster capacity fade that drive up the true cost of delivered energy.
The industry is increasingly moving toward long‑duration storage and high‑cycle applications where the gap between price per kilowatt‑hour and cost per megawatt‑hour widens dramatically. A system that completes many cycles per year with minimal degradation will deliver a much lower LCOS than one that looks cheaper on a spec sheet but requires early augmentation. Understanding this shift is the foundation of sound procurement engineering.
The LCOS Framework: Calculating Levelized Cost of Storage
LCOS is calculated by dividing the total lifecycle costs—including charging energy—by the total energy discharged over the system’s life. It is the storage equivalent of LCOE (Levelized Cost of Energy) used for generation, but it incorporates the cost of the electricity used to charge the battery and the efficiency penalty incurred during charging and discharging.
CAPEX vs. OPEX in Utility‑Scale Systems
Capital expenditure covers the battery cells, modules, power conversion system, containerization, Balance of System (BOS) costs, and initial integration. For a typical 4‑hour duration BESS, CAPEX can represent 40‑50% of total lifecycle cost. Operating expenses include scheduled and unscheduled maintenance, control software, thermal management power, personnel, and—critically—augmentation, which is the periodic addition of new capacity to offset degradation. In high‑cycling deployments, augmentation alone can shift cost projections by double‑digit percentages. Buyers should ask suppliers for detailed OPEX pro formas that separate fixed O&M from the cost of supplemental capacity, rather than accepting a blanket “cents per cycle” estimate.
The Impact of Round‑Trip Efficiency (RTE)
Round‑trip efficiency directly inflates the effective cost of stored energy because every percentage point of loss means more electricity must be purchased to deliver the same usable output. A 90% RTE system requires 1.11 MWh of charge to deliver 1 MWh; an 85% system needs 1.18 MWh. Over a 10‑year life and hundreds of thousands of megawatt‑hours, that gap compounds into significant additional energy cost. When calculating LCOS, RTE applies to both the denominator (delivered energy) and the numerator (charging cost). Engineers often run sensitivity analyses on RTE because it is not a fixed number—it degrades slightly over calendar life and can dip under partial loading or temperature stress. Viewing RTE as a “hidden operational tax” helps procurement teams prioritize efficiency alongside upfront price.
Technical Comparison: Lifecycle Costs by Battery Chemistry
While LFP currently dominates capex‑sensitive deployments, flow batteries can deliver lower lifecycle costs in high‑cycle, long‑duration applications due to their ability to operate at full depth of discharge with negligible degradation. The selection decision hinges on the relationship between cycle frequency, project duration, and the cost of replacement capacity.
| Chemistry Type | Typical Cycle Life (full equiv.) | Usable DoD Limit | Average CAPEX ($/kWh) | Estimated LCOS ($/MWh) |
|---|---|---|---|---|
| Lithium Iron Phosphate (LFP) | 4,000 – 7,000 | 80 – 90% | $250 – $400 | $150 – $200 |
| Nickel Manganese Cobalt (NMC) | 1,500 – 3,000 | 70 – 80% | $200 – $350 | $200 – $300 |
| Vanadium Redox Flow Battery (VRFB) | 10,000 – 20,000+ | 100% (no degradation) | $400 – $600 | $100 – $150 |
Note: LCOS estimates are illustrative for a 4‑hour system operating 365 cycles/year under standard assumptions. Actual values depend on project scale, local costs, operating strategy, and manufacturer specifications. Always verify with project‑specific models.
For applications that cycle once per day or less, LFP’s lower installed cost often produces the best economic outcome. But in throughput‑intensive roles—such as frequency regulation or arbitrage in markets with large spreads—the extended calendar life and full‑depth cycling of VRFB can lower the $/MWh figure by 25‑40% over a 20‑year horizon. NMC, while offering high energy density, generally trails both chemistries in BESS lifecycle economics due to faster degradation and narrower operating windows, unless weight or space are the dominant constraints.
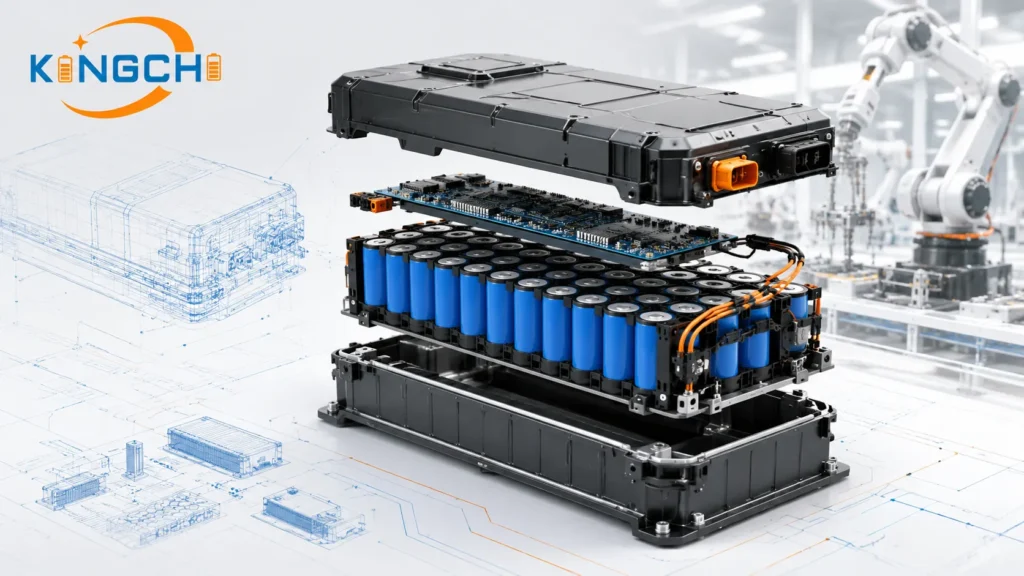
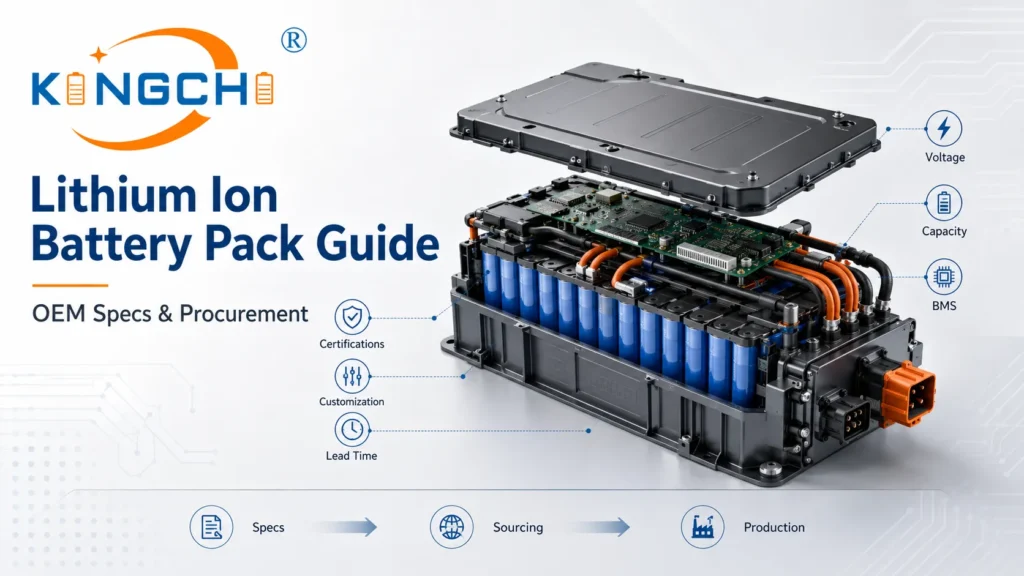
One strategic consideration concerns lithium-ion battery packs and their pack‑level design influences on cost. A poorly integrated pack can accelerate cell imbalance and raise the effective lifecycle cost even when using high‑grade cells. Our lithium-ion battery pack engineering guide explores how cell matching and thermal pathways affect long‑term performance.
Critical Variables Affecting Battery Lifespan and Throughput
Operating a battery at elevated temperatures or extreme Depth of Discharge levels accelerates capacity fade, which directly drives up the cost per delivered MWh. Even small changes in daily cycling depth or pack temperature can shift the replacement schedule by several years, altering the entire project financial model.
Depth of Discharge (DoD) and Cycle Life
The relationship between DoD and cycle life is exponential rather than linear. A cell cycled to 80% DoD may achieve 5,000 equivalent full cycles, while the same cell limited to 60% DoD could surpass 8,000 cycles. This trade‑off means that oversizing the battery to keep the operating window shallow can lower LCOS if the extra capacity cost is offset by longer life and reduced augmentation expense. However, there is a breakeven point: adding too much unused capacity increases CAPEX without sufficient throughput gain. Technical buyers should model DoD‑vs‑life curves against the specific duty cycle, not rely on manufacturer “typical” numbers. The battery management system plays a pivotal role here by enforcing operational limits that preserve cycle life while still meeting power requirements.
Thermal Management and Capacity Fade
Elevated temperature is the dominant accelerator of calendar aging. For Li‑ion chemistries, every 10°C rise above the nominal operating range can double the rate of capacity fade and degradation. In containerized BESS, even a well‑designed HVAC system can create internal temperature gradients of 5‑7°C across the racks, leading to uneven aging and premature need for stack replacement. Integrating active cooling with predictive control can add 2‑4 years of economic life in hot climates, making the initial thermal management investment one of the highest‑return engineering decisions in the project. We routinely see projects where an extra $20‑40/kW spent on liquid cooling loops reduces LCOS by more than 15% over a 15‑year horizon.
Comprehensive Breakdown of Lifecycle Cost Components
A complete TCO analysis for a BESS project must account for Balance of System costs, integration labor, software licensing, and end‑of‑life obligations. Ignoring these categories—or rolling them into a single “other” line—is the quickest way to miss 25‑35% of true lifecycle cost.
| Phase | Cost Category | Description | Typical % of Lifecycle Cost |
|---|---|---|---|
| Acquisition | Cells, modules, inverters, BOS | Hardware purchase and delivery | 40 – 50% |
| Integration | Installation, commissioning, grid connection | Civil works, electrical contracting, interconnection fees | 10 – 15% |
| Operations & Maintenance | O&M labor, monitoring, cooling, augmentation | Routine service, BMS monitoring, energy for thermal control, replacement capacity | 25 – 35% |
| End‑of‑Life | Decommissioning, transport, recycling | Safe removal, compliance with local regulations, material recovery | 5 – 10% |
Note: Percentages are indicative for a utility‑scale LFP BESS project. Actual distribution varies with system design, operating strategy, warranty structure, and regional labor and disposal costs. Run project‑specific models for accurate projections.
Augmented capacity—adding fresh battery racks during the life of the plant to maintain nameplate power and energy—can be the single largest OPEX line item. Some operators treat augmentation as a separate capital outlay, but including it in the lifecycle model is necessary to avoid understating the real cost of delivered energy. Similarly, end‑of‑life (EoL) management involves more than dismantling. Recycling costs for LFP are currently higher than the recovered material value, while vanadium electrolyte in flow batteries retains significant resale value that can partially offset LCoS. When evaluating competing chemistries, ask suppliers for a written breakdown of projected EoL net cost, not a placeholder percentage.
For organizations building bespoke systems, working with a custom battery pack manufacturer that embeds lifecycle cost modelling into the design phase can help integrate these cost categories from the start, rather than treating them as a post‑design afterthought.
Future Cost Trajectories and Technology Trends
Lithium‑ion battery prices have fallen by roughly 99% since 1991, driven by manufacturing scale, chemistry refinements, and pack‑level integration. The next wave of lifecycle cost improvement will come from production efficiency, the emergence of sodium‑ion for stationary storage, and the institutionalization of second‑life battery markets that extend the use of retired EV modules in grid applications.
By 2030, several trends could reshape BESS economics. Sodium‑ion cells, though lower in energy density, may approach $40‑50/kWh at scale and offer wider temperature tolerance, potentially displacing LFP in two‑ to four‑hour applications where weight is irrelevant. Solid‑state technologies promise higher safety and longer calendar life, but high‑volume manufacturing remains a challenge. Meanwhile, flow battery providers are targeting greater standardization to bring CAPEX down while maintaining their nearly unlimited cycle life advantage. None of these advances eliminates the need to compute LCOS per specific use case; they simply shift the numbers. The procurement lesson remains the same: lock in a robust lifecycle model now, and update the assumptions as the technology matures.
Optimizing Your Storage Investment
Selecting the right battery technology requires matching the chemistry’s lifecycle profile to the exact use case—whether that’s sub‑second frequency response, daily peak shaving, or multi‑day energy shifting. A mismatch can erase the theoretical LCOS advantage almost entirely.
A disciplined approach starts with defining the required throughput in MWh of throughput per year, the expected daily cycles, and the ambient conditions at the installation site. From there, the engineering team can run sensitivity models that vary DoD, RTE, and degradation rate to find the lowest LCOS solution that meets performance constraints. In many projects we support, a slight oversizing of the battery combined with a conservative DoD setpoint delivers a 10‑15% improvement in $/MWh over the design life—money left on the table by buyers who focused exclusively on initial $/kWh.
Design choices made at the pack level also ripple through the project economics. A custom battery pack design optimized for the specific thermal and cycling conditions can reduce balancing current demand, improve cell balancing accuracy, and lower auxiliary power consumption—each of which feeds directly into a reduced lifecycle cost. Kingchi’s engineering team routinely helps developers evaluate these trade‑offs at the feasibility stage, before procurement commitments are made.
If you are preparing a BESS business case or updating your technology roadmap, we recommend running a tailored LCOS simulation using your actual load profiles and site constraints. Our technical team can provide a consultation and share calculation templates that move from high‑level chemistry benchmarks to an investment‑grade cash‑flow view. This is not about recommending a single product—it’s about giving your engineering and procurement groups the right decision framework.
Frequently Asked Questions
What is the typical lifecycle of a grid‑scale LFP battery?
Most utility‑grade LFP systems are designed for 10‑15 years of service, delivering 3,000‑7,000 equivalent full cycles depending on the average depth of discharge and operating temperature. Augmentation at the mid‑life point can extend the project life beyond the initial rated degradation curve.
How does LCOS differ from LCOE?
LCOE measures the cost of generating electricity from a source like solar or wind, while LCOS specifically accounts for the cost of storing and discharging that electricity, including the charging energy purchase and round‑trip efficiency losses. They are complementary metrics in a full hybrid project model.
What are “augmentation costs” in a BESS project?
Augmentation costs refer to the expense of adding new battery capacity over time to compensate for capacity fade and energy degradation, keeping the system able to meet its guaranteed power and energy obligations. These costs can be planned in the original financial model or treated as an operational contingency.
Is recycling included in lifecycle cost models?
Yes, a complete lifecycle model includes end‑of‑life net cost—the expense of decommissioning, transport, and processing minus the residual value of recovered materials. For LFP, recycling may be a net cost; for vanadium flow batteries, the electrolyte often retains a positive scrap value that offsets part of the initial CAPEX.
Frequently Asked Questions
Get a Fast, Custom Power Quote